When we wrote the annual outlook last November, the data was mixed. Some metrics hinted at emerging cracks in the economy while others suggested the growth trajectory in capital markets and the economy had legs. So, the variety of the data produced the narrative that business activity in the New Year would grow on an annual basis but experience some bumps in the first half of the year. Now, enter the revisions.
Strong Job Momentum Has Surprised
In the latest employment report, the Bureau of Labor Statistics (BLS) issued revisions to the prior 12 months, and it turns out that firms added more jobs in 2023 than originally reported. As last year ended, investors thought businesses added 2.7 million jobs, but after revisions, businesses added roughly 3.1 million.
Job Growth Healthier Than Originally Reported
Revisions Reveal Stronger Momentum in Payroll Employment
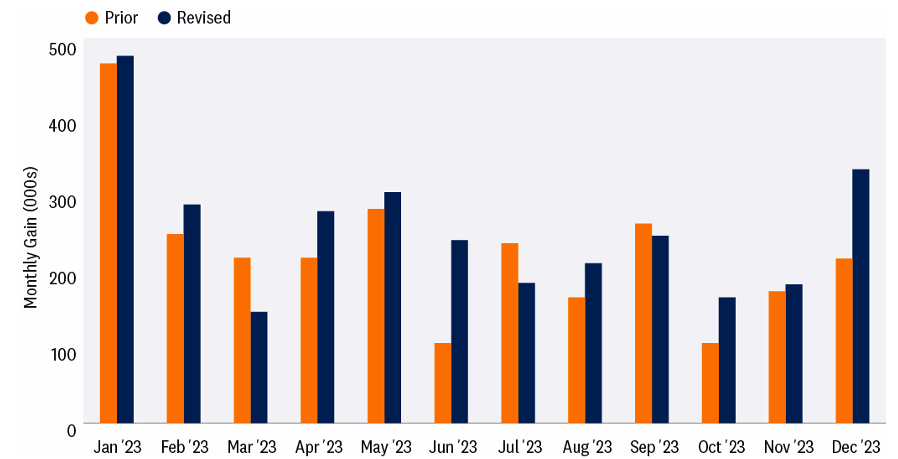
Source: LPL Research, U.S. Bureau of Labor Statistics 02/06/24
The stronger employment figures tell us that businesses and households have stronger momentum going into 2024, and therefore, we believe it is prudent to increase our forecasts for economic growth. Headwinds remain but on an annual basis, we believe the U.S. and global economy is poised for a bit stronger growth this year than originally forecasted last year.
LPL Research Has Raised Its GDP Growth Forecasts As Odds Of A Soft-Landing Risel
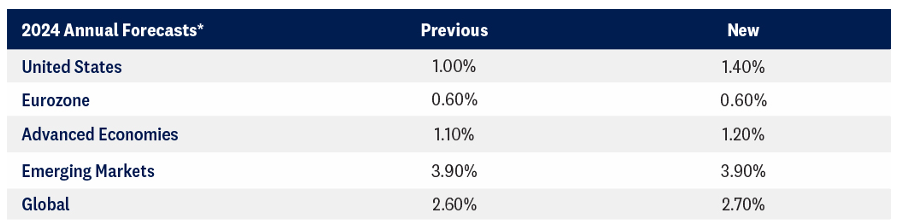 *Annual Average, Y/Y
Source: LPL Research 02/09/24
Forecasts may not materialize as predicted and are subject to change.
It’s More Than Just Jobs
Another factor that suggests the economy could move through this year with fewer headaches is the improving credit conditions. The latest Senior Loan Officer Survey tells us credit supply and credit demand are getting into better balance. Financial conditions improved in recent months as fewer banks tightened credit conditions in Q4 because fewer firms were pessimistic about demand. As investors digest the experience of loan officers, historically we experienced recessions when credit was this restricted. Improving credit conditions suggest the economy had good momentum as the New Year got underway and markets are responding accordingly.
Less Tightening From Banks Along With Improving Trajectory In Demand
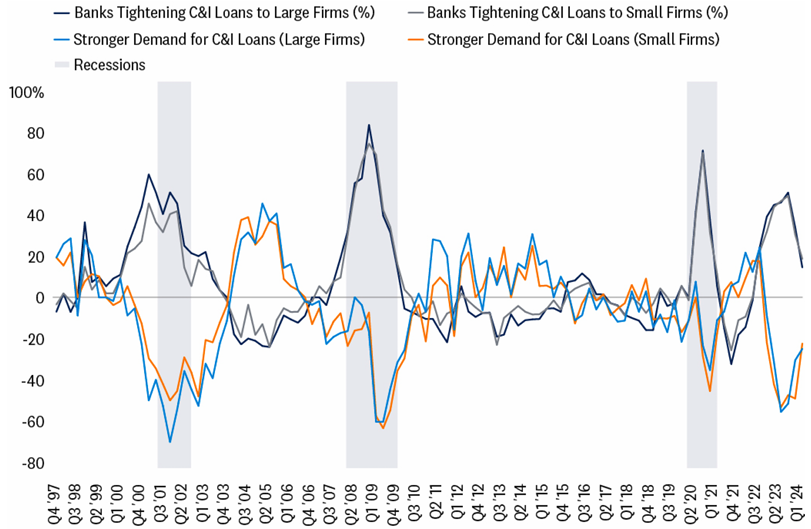
Source: LPL Research, Federal Reserve Board 02/06/24
Consumers Have More Room To Run
Tight labor markets and improving credit conditions create a favorable environment for both consumers and businesses. But let’s focus on the consumer here. Since the pandemic, consumer spending on durable goods, such as cars and household furnishings, plus demand for nondurable goods, have been strong and above trend. We think some of that spending was pulled forward from future demand, and we should expect a tapering of spending on goods.
Services spending experienced something drastically different. The pandemic took a toll on services demand and after several years, consumers are finally back on trend for services. We think consumer spending will revert to the mean this year, but the strong momentum we have from jobs and credit suggest the reversion to the mean will be pushed out later — just like the timing of the first Federal Reserve (Fed) rate cut, which may not come until June.
Services Spending Back To Pre-Pandemic Trend
Goods Spending Will Likely Revert Down to Trend
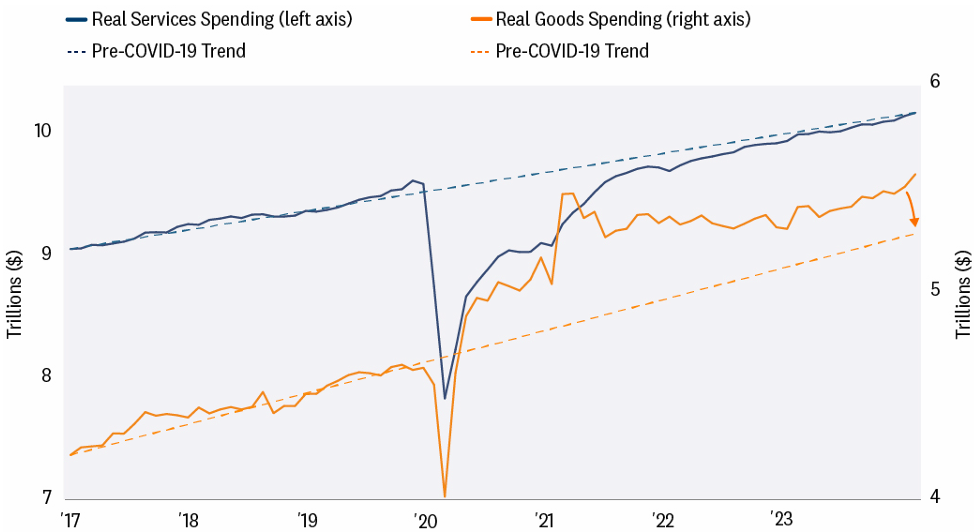
Source: LPL Research, U.S. Bureau of Economic Analysis 02/09/24 (Data through 01/31/24)
More Fiscal Stimulus May Be On The Way
President Biden lined up spending on infrastructure (Infrastructure Investment & Jobs Act of 2021), clean energy (Inflation Reduction Act of 2022, or IRA), and semiconductor manufacturing (CHIPs Act of 2022) to ramp up this year to help cushion his re-election campaign. The White House knows no U.S. president has been re-elected during or soon after a recession. This new investment spending will partially offset the consumer stimulus from previous years rolling off. This year will see the first big wave of IRA spending that is expected to mostly come by 2026 (though a GOP victory in 2024 will curb some of that in 2025 to pay for extending the Trump tax cuts).
In other fiscal news, a tax bill cleared the House on January 31 and is now being considered by the Senate. Provisions in the bill have been scored by the Joint Committee on taxation at roughly $120 billion in 2024. Strategas policy strategist Dan Clifton estimates $136 billion in fiscal stimulus from the bill, though passage is far from assured, especially considering these dollars could influence voters in swing states which may cause Republicans to balk. The same can be said for the defense (Ukraine, Israel, Taiwan, and Red Sea) and southern border deals that came out of the Senate and face uncertain futures. Should these bills get through Congress, the odds that 2024 GDP growth has a 2-handle — though not our base case — will increase. We have raised our GDP growth forecast for this year from 1% to 1.4% and marginally increased growth forecasts for developed international economies due to some positive spillover.
Importance Of Energy Costs Cannot Be Overstated
The Biden Administration needs to do everything it can to avoid a spike in energy prices. A spike in oil prices may be the biggest risk facing Biden at the polls this fall. Some of the best predictors of elections historically have been inflation-adjusted, after tax income and the misery index (unemployment plus inflation), which could both jump if energy prices rise.
What can they do? First, while the Strategic Petroleum Reserve has not been refilled, more could still be released to curb potential price increases. The Biden Administration has tried to protect oil shipments in the Middle East, which may also help. And they can stay out of the way from a regulatory perspective, which to an extent they have done because U.S. oil production is at a record high. (Note that the recent decision by the Administration to pause approvals of LNG exports is unlikely to affect exports in 2024 and is probably mostly a nod to climate activists at this point.)
More broadly, prices are elevated after several years of high inflation, so even though the pace of price increases has slowed, consumers are paying a lot more at the grocery store than they did when the pandemic began. Simply put, there’s little margin for error here with the situation in the Middle East largely out of the White House’s control.
Conclusion
The S&P 500 has eclipsed a key milestone in closing above 5,000. These big round number breakthroughs have historically preceded solid gains over the subsequent six and 12 months, averaging 9% and 10.4%, respectively, going back to when the S&P 500 cleared 100 in 1968. The strong gains this year have left valuations elevated, but with improved prospects for a soft landing and earnings growth, these gains appear mostly justified. Geopolitics and rates remain the key risks and, along with valuations, point to modest gains for stocks over the balance of 2024. Our year-end fair value target for the S&P 500 at 4,950 is under review.
Asset Allocation Insights
LPL’s Strategic and Tactical Asset Allocation Committee (STAAC) maintains its neutral equities stance despite the strength of the latest stock market rally that has carried the S&P 500 over the 5,000 milestone. The improved outlook for economic growth and earnings, along with relative stability in interest rates as inflation is poised to continue to move lower, keeps the risk-reward trade-off for stocks and bonds fairly well balanced, though upside over the balance of the year is likely to be fairly modest.
Within equities, the STAAC continues to favor a tilt toward domestic over international, with a preference for Japan among developed markets, and an underweight position in emerging markets (EM). The Committee also recommends a slight tilt toward large caps and growth stocks. Finally, the STAAC continues to recommend a modest overweight to fixed income, funded from cash.
IMPORTANT DISCLOSURES
This material is for general information only and is not intended to provide specific advice or recommendations for any individual. There is no assurance that the views or strategies discussed are suitable for all investors or will yield positive outcomes. Investing involves risks including possible loss of principal. Any economic forecasts set forth may not develop as predicted and are subject to change.
References to markets, asset classes, and sectors are generally regarding the corresponding market index. Indexes are unmanaged statistical composites and cannot be invested into directly. Index performance is not indicative of the performance of any investment and do not reflect fees, expenses, or sales charges. All performance referenced is historical and is no guarantee of future results.
Any company names noted herein are for educational purposes only and not an indication of trading intent or a solicitation of their products or services. LPL Financial doesn’t provide research on individual equities.
All information is believed to be from reliable sources; however, LPL Financial makes no representation as to its completeness or accuracy.
US Treasuries may be considered “safe haven” investments but do carry some degree of risk including interest rate, credit, and market risk. Bonds are subject to market and interest rate risk if sold prior to maturity. Bond values will decline as interest rates rise and bonds are subject to availability and change in price.
The Standard & Poor’s 500 Index (S&P500) is a capitalization-weighted index of 500 stocks designed to measure performance of the broad domestic economy through changes in the aggregate market value of 500 stocks representing all major industries.
The PE ratio (price-to-earnings ratio) is a measure of the price paid for a share relative to the annual net income or profit earned by the firm per share. It is a financial ratio used for valuation: a higher PE ratio means that investors are paying more for each unit of net income, so the stock is more expensive compared to one with lower PE ratio.
Earnings per share (EPS) is the portion of a company’s profit allocated to each outstanding share of common stock. EPS serves as an indicator of a company’s profitability. Earnings per share is generally considered to be the single most important variable in determining a share’s price. It is also a major component used to calculate the price-to-earnings valuation ratio.
All index data from FactSet.
Value investments can perform differently from the market as a whole. They can remain undervalued by the market for long periods of time.
The prices of small cap stocks are generally more volatile than large cap stocks.
International investing involves special risks such as currency fluctuation and political instability and may not be suitable for all investors. These risks are often heightened for investments in emerging markets.
LPL Financial does not provide investment banking services and does not engage in initial public offerings or merger and acquisition activities.
This research material has been prepared by LPL Financial LLC.
Securities and advisory services offered through LPL Financial (LPL), a registered investment advisor and broker-dealer (member FINRA/SIPC). Insurance products are offered through LPL or its licensed affiliates. To the extent you are receiving investment advice from a separately registered independent investment advisor that is not an LPL affiliate, please note LPL makes no representation with respect to such entity.
Not Insured by FDIC/NCUA or Any Other Government Agency | Not Bank/Credit Union Deposits or Obligations | Not Bank/Credit Union Guaranteed | May Lose Value
RES-000662-0124 | For Public Use | Tracking #539605 (Exp. 02/2025)
For a list of descriptions of the indexes referenced in this publication, please visit our website at lplresearch.com/definitions.